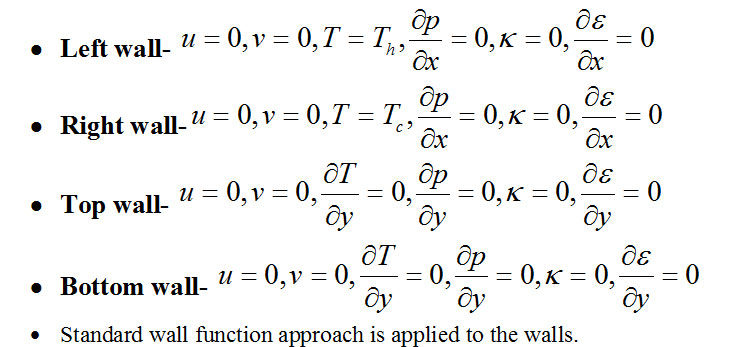
MODULES
Turbulent Natural Convection In Differentially Heated Cavity
Problem Definition:
Natural convection in a differentially heated square cavity for higher Raleigh numbers are simulated using Standard κ− model. Stream lines, isotherms and Nusselt numbers are compared with the benchmark solutions. A Geometry of this problem is given in Fig. 3.1. Non-dimensionalization is done for governing equations including κ and equations.
Parameters used:
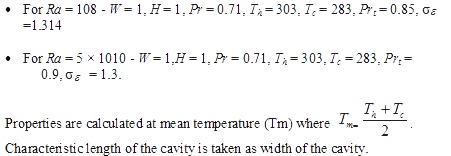
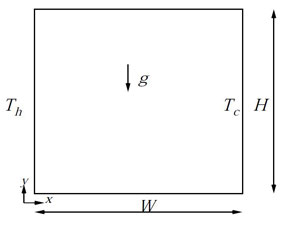
Figure 3.1: Geometry of Turbulent natural convection

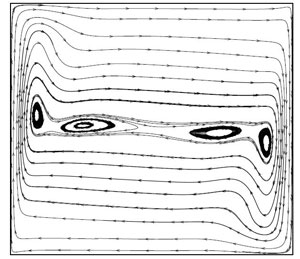
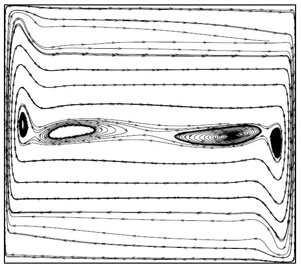
70 × 70 grid is made with fine mesh closer to the walls. First grid point is located at 2.8 × 10⁻³. The stream lines and temperature contour for Ra = 108 is given in Fig. 3.2(a) and 3.2(b).
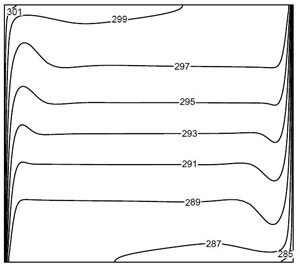
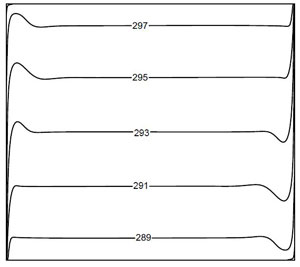
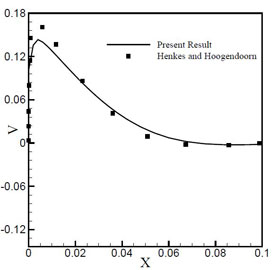
When the Raleigh number increases to Ra = 108, the secondary vortices in the stream lines are convected towards the differentially heated wall. The central vortex is diffused into the other two vortices. When the Raleigh number further increases, the secondary vortices in the stream lines are further convected towards the differentially heated walls. The isotherms are also horizontal lines except closer to the walls. This indicates that most of the heat transfer takes place by convection. Figure 3.4 shows the Non-dimensional distribution of vertical velocity and temperature.
(a)
(b)
Figure 3.2: For Ra = 108 (a) Stream lines (b) Temperature contour
(a)
(b)
Figure 3.3: For Ra = 5 × 10¹⁰ (a) Stream lines (b) Temperature contour
(a)
(b)
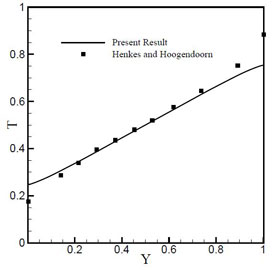
Figure 3.4: (a) Vertical velocity distribution at y* = 0.5 (b) Temperature distribution at x* = 0.5
Table 3.1 shows the average nusselt number along the hot wall for different Raleigh numbers. When the Raleigh number increases, nusselt number also increases.
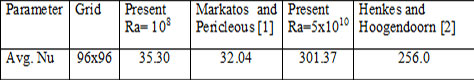
Table 3.1: Avg. Nusselt number comparison
[1] Markatos N.C. and Pericleous K.A. (1984) ‘Laminar and turbulent natural convection in an enclosed cavity’, International Journal of heat and mass tranfer, vol. 27, pp. 755–772.
[2] Henkes R.A.W.M. and Hoogendoorn C.J. (1995) ‘Comparision exercise for computations of turbulent natural convection in enclosures’, Numerical Heat Transfer, vol. 28, pp. 59–78.
