
Welcome to Vishleshakee help page
About Vishleshakee
VISHLESHAKEE is a Social Media Analysis Tool developed at Open Source Intelligence Lab, Indian Institute of Technology, Guwahati, India. The tool is developed using open source technologies and uses publicly available data for analysis. The current version 2.0.0 of the tool considers open-sourced Twitter (a social micro-blogging platform) data collected via its provided API as the data source.
VISHLESHAKEE acts as a generalized information platform by providing the general public, knowledge about recent topics of discussion on social media. The tool denotes the topics in terms of Twitter hashtags and categorizes them into classes of Trending, Security, and Communal. Also, the associated public sentiments and locations of discussion can be easily visualized from the tool. Besides acting as a generalized information platform VISHLESHAKEE is also empowered with specialized modules for in-depth analysis of various social media contents. Access to such in-depth analysis adds values to the knowledge base of different law enforcement, homeland security, and other relevant agencies about the monitored topic of discussions. The latest version of the tool has 5 such modules, namely:-
- Location Monitor
- Trend Analysis
- Historical Analysis
- Network Analysis
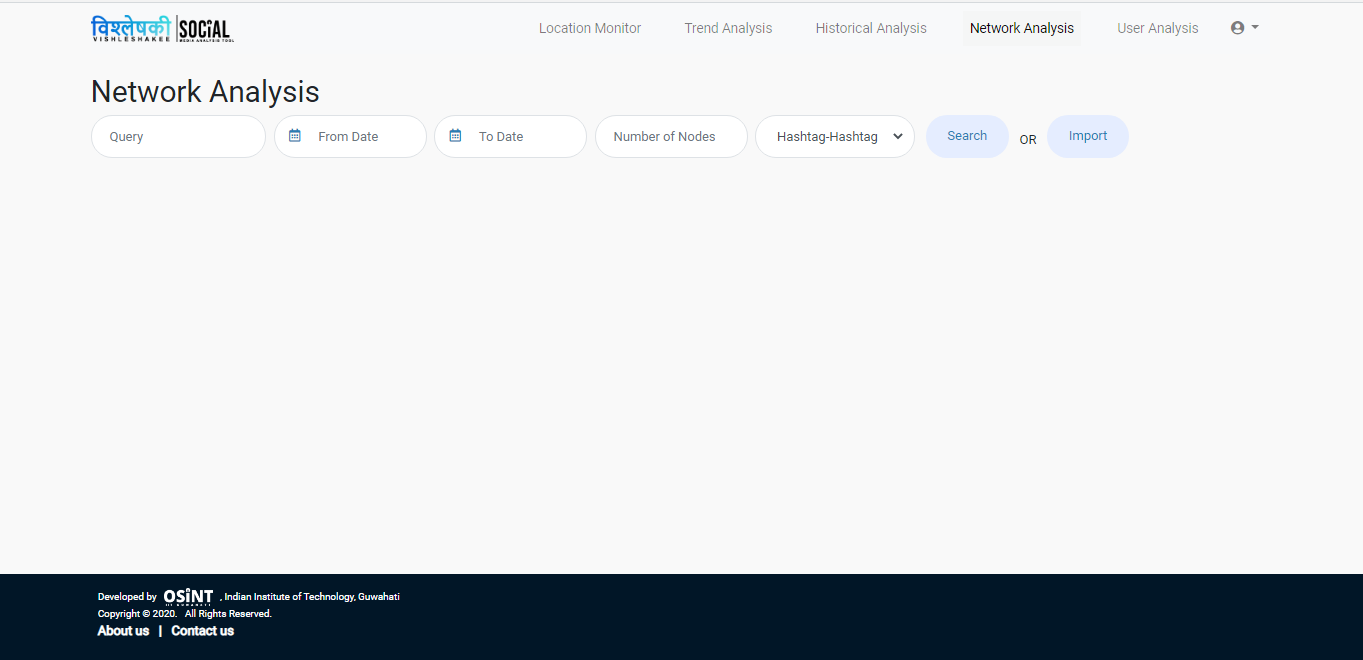
- Query: The query is the input given by the user it may be a hashtag or a mention or a user ID, or a keyword. Sample Inputs: #JNU, @ndtv, narendra modi, cricket
- From Date: Starting date of the range query
- To Date: Ending date of the range query
- Network Size: The upper bound on the number of nodes to be generated for the query. Say, 50 or 100.
- Network Choice: The selector provides the facility to generate different networks. One need to select appropriate network to be generated for the given query
- Hashtag-Hashtags.
- Hashtag-Mentions.
- Hashtag-User
- Mention-Mentions
- Mention-Hashtags.
- Mention-Users.
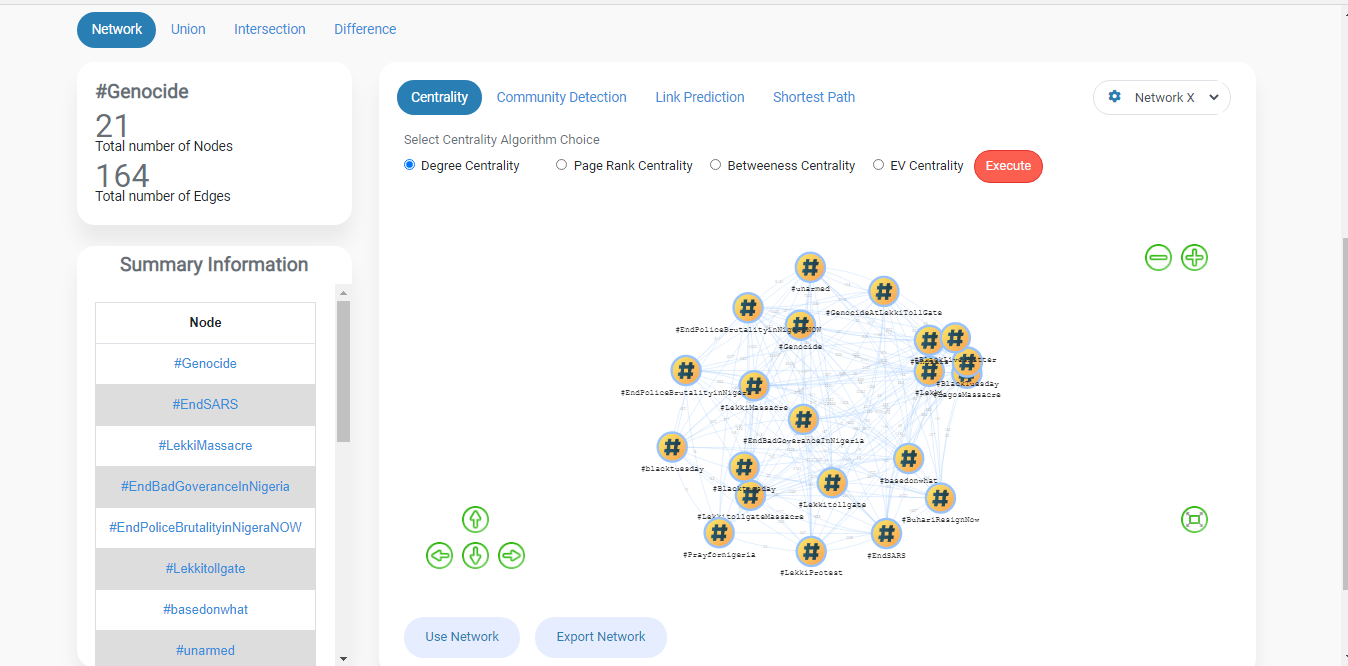
- Degree Centrality
- Eigen Value Centrality
- Betweeness Centrality
- Page Rank Centrality
- Click on the blue colored Centrality Tab
- Select the algorithm choice for the centrality finding provided via the radio buttons.
- Click on the EXEC button.
- Async Fluidic
- Label Propagation
- Grivan Newman
- Click on the community Detection Tab
- Select the appropriate algorithm choice, if you select Async Fluidic as the algorithm you need to provide the number of communities to be generated
- Click on the EXEC button.
- Shortest Path
- K-Shortest Path
- All Possible Shortest Path per depth
- Click on the Shortest Path Tab
- Provide Source and Destination node. One can provide this information directly in the query box or by clicking on the nodes in the graph. The selection of two nodes from the graph: First node can be selected by a direct single click while the selection of the next node requires Cmd+click on the node.
- Select the Algorithm choice and Click on the EXEC button
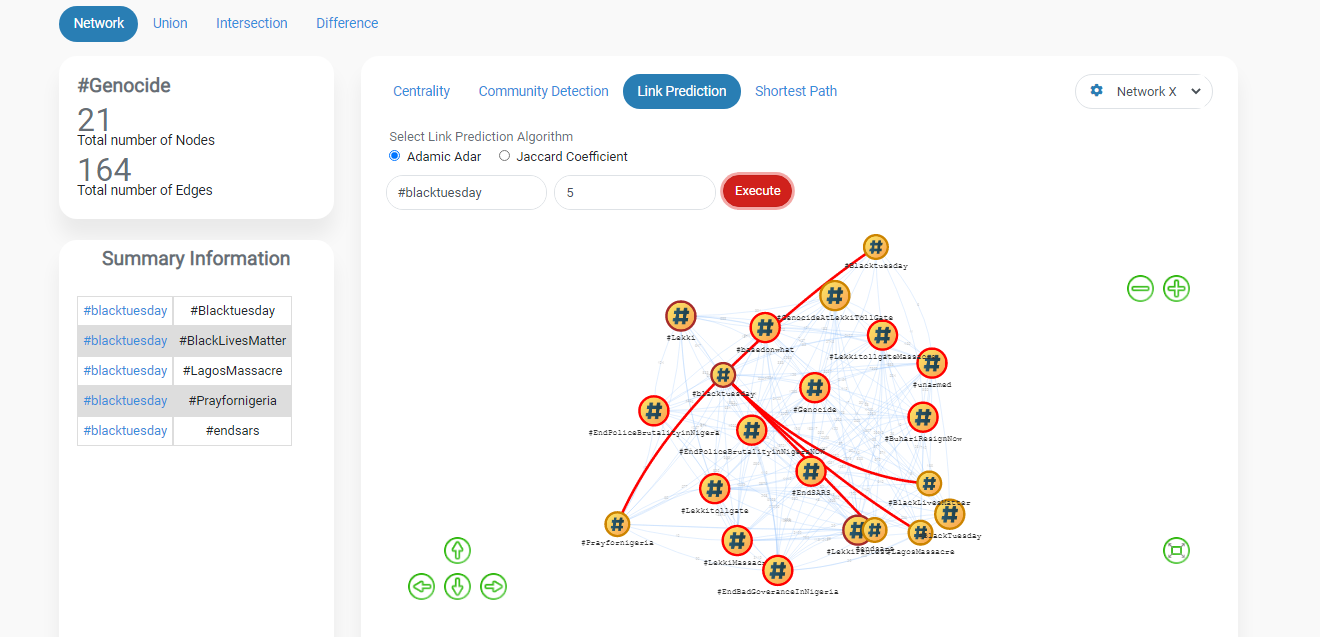
- Adamic Adar
- Jaccard Coefficient
- Click on the link prediction Tab
- Select the Algorithm choice.
- Select a node from the graph.
- Provide the number of top k links to be predicted.
- Click on the EXEC button
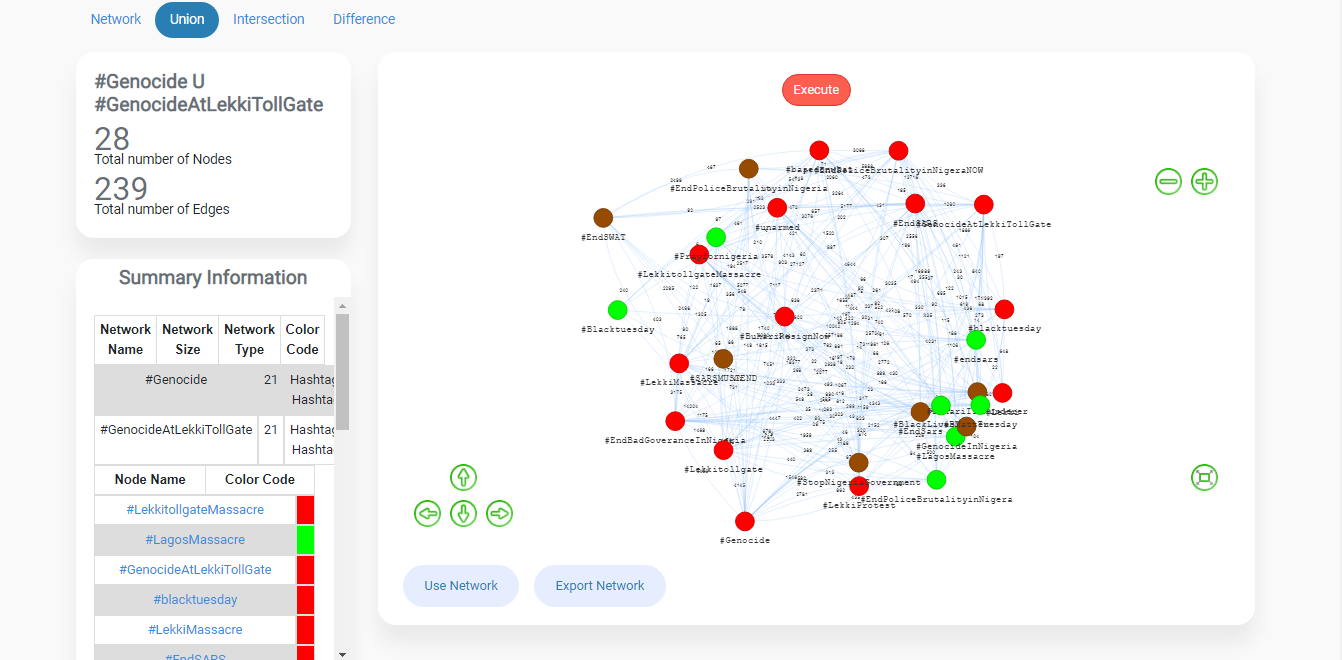
- Select two graphs
- Click on Union View Panel.
- Click on EXEC Button
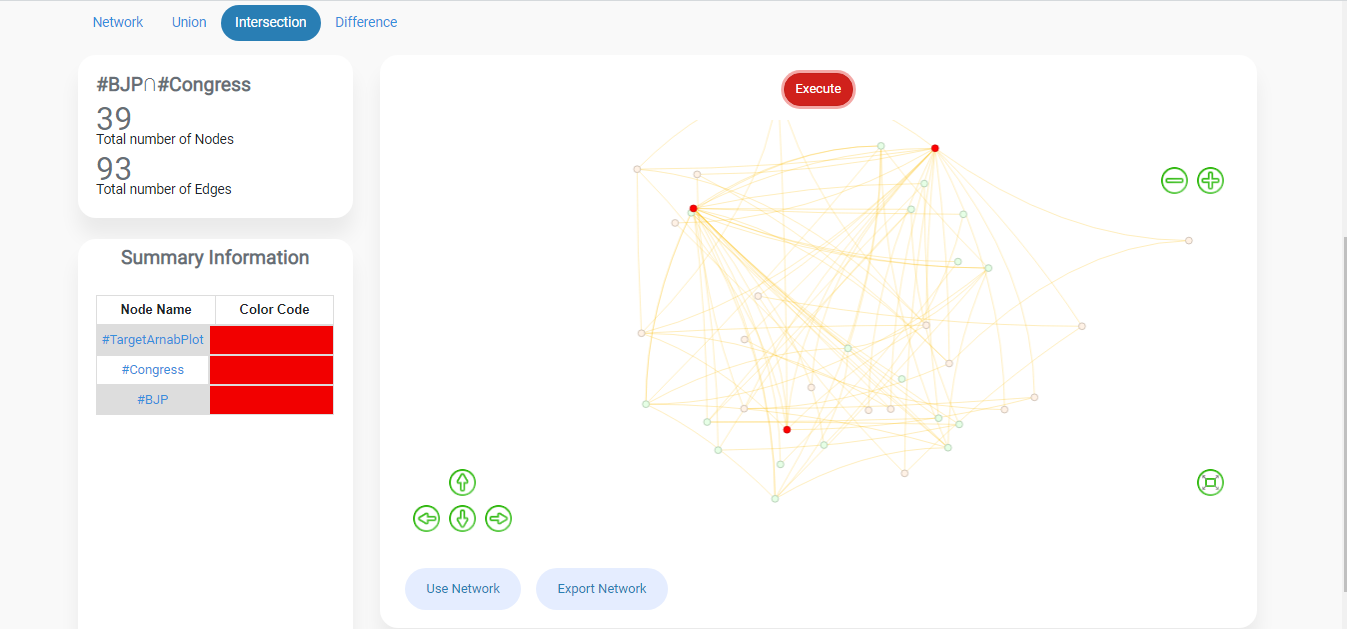
- Select two graphs
- Click on Intersection View Panel.
- Click on EXEC Button
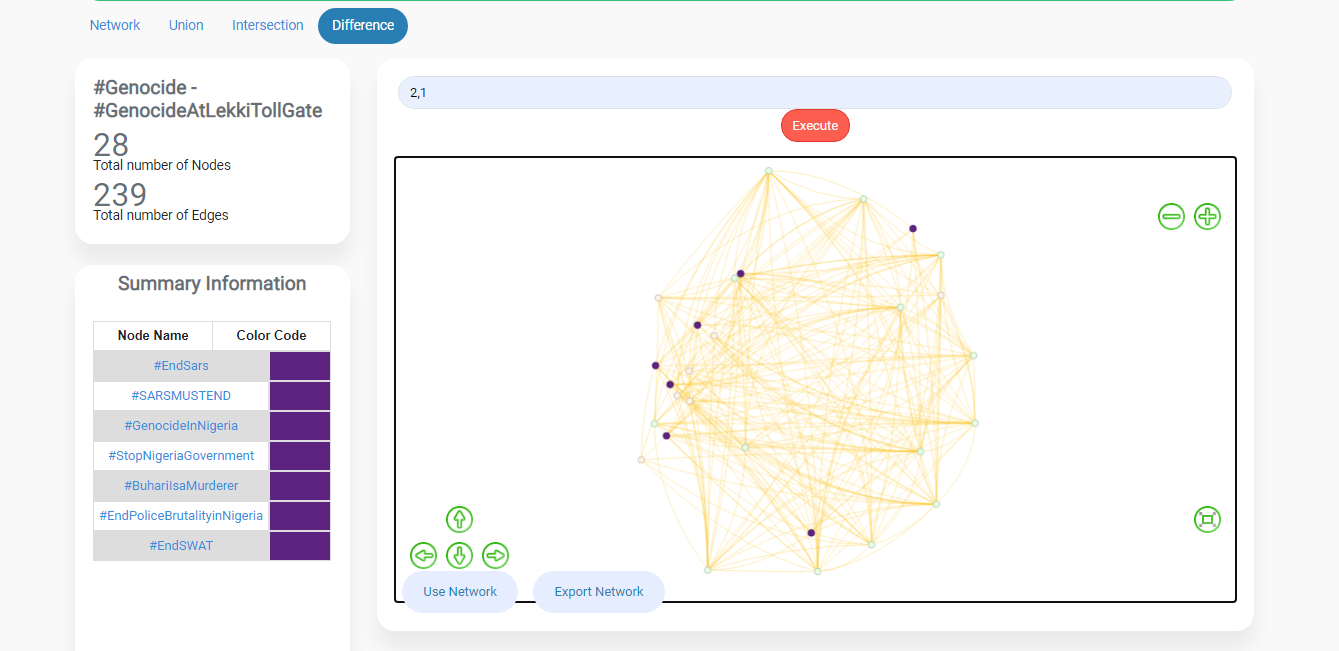
- Select two graphs
- Click on Difference View Panel.
- Input the network IDs as per the ordering in which you want to perform the difference.Say, if you want to perform difference of network 1 from network 2, then you should add network 2 first and then network 2
- Click on Perform Difference Button.
- User Analysis
The Network Analysis module of Social Media Analysis Tool VISHLESHAKEE provides the functionality of analyzing different types of networks obtained from the system as well as networks that are being imported from the external source. As, the social media data is highly relational analysing them from the relational perspective can help gaining a better insight. The networks currently being supported by the system can be seen from the Network choice selector in the query panel. The module can generate a network given by the user with the required mandatory information and can perform various analysis on them. The rest of the manual provide the steps to be followed for generating a network and doing suitable analysis on them.
Minimum User Device Specification: 4 GB (RAM)
Recommended User Device Specification: >= 8 GB (RAM)
Network Generation
Network Generation from User Inputs
For generating the network, a user is required to provide the following mandatory information.
Network Generation from External File Upload
A network can also be generated by importing data from external source. The module currently accepts .csv files as edgelist (in the format of [src,dst,count]) as an external source for network generation.
Once, the graph is being generated a number of operations can be performed upon that. The analytical operations supported by our module with the steps to be followed are given below: -
For, going for performing the analytical operations on the graph the user needs to click on the PERFORM ANALYSIS button present in the right-hand side of the screen. Clicking, on the button will provide the user the choice buttons for the analytical operations:
Centrality
In social networks, centrality is an indicator of identifying important nodes in a network. Our
module provides the following variants of centrality:
For performing the centrality operation on the network. The following steps need to be followed:
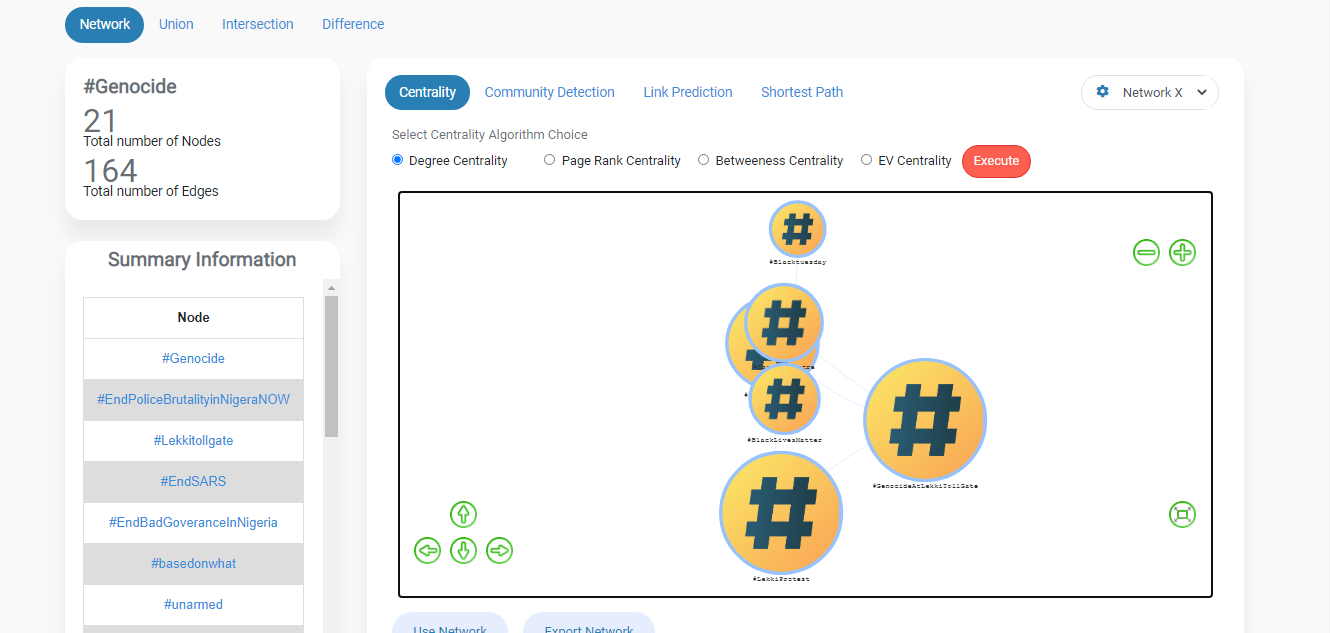
Upon success of the query the resultant graph will be displayed in the same panel. Zoom out the division for letting the graph to be displayed as a whole.
Community Detection
In social networks Community Detection aims to group similar nodes together, thus discovering hidden communities present. Our module provides the following variants of Community
Detection
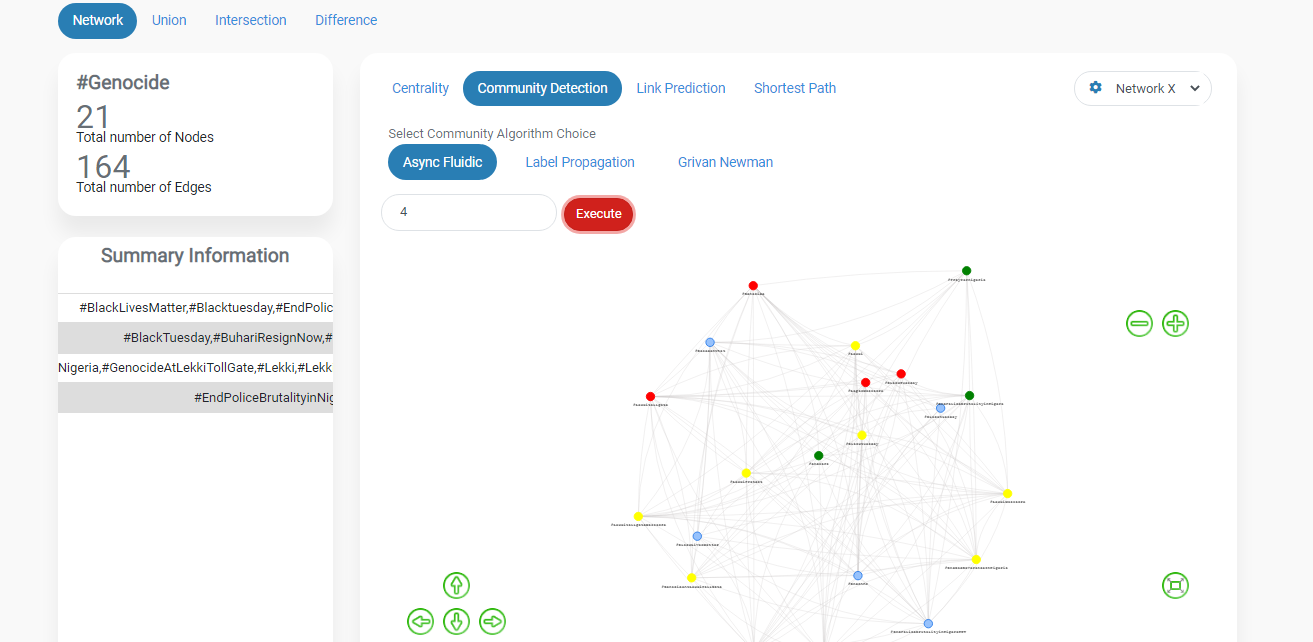
Steps to be followed for finding out the communities in the graph
In the above Community Detection sample output each color defines a community where the nodes with similar color belongs to the same community. Upon successful query a graph will be displayed in the same panel with communities in different colors.
Shortest Paths
Shortest path aims to find a shortest path between a pair of nodes in the network. Our module provides the following variants of Shortest Path.
Steps for finding the shortest path in the graph is as follows:
On successful query the source and target node will be enlarged also the edge between them will be bold. If any intermediate node exists between the two nodes, then the intermediate node will also be enlarged colored in different color from the source and destination node.
Link Prediction
Link prediction aims to predict future connections between nodes based upon their present neighbbourhood. Our module provides the following variants of link prediction.
Union of Networks
Union aims to combine different networks into a single network. Prerequisite: Generate two graphs from the Network Generation Panel. Make sure both the graphs are selected.
Intersection of Networks
Intersection aims to find out the common nodes in a given number of input networks. Perquisite is as same as the union operations. Steps:
Difference of Networks
Difference of networks aims to discover uncommon nodes from a network with an another network. Upon successful query a graph with the intersection of two graphs will be displayed. Perquisite is as same as the union operations. Steps:
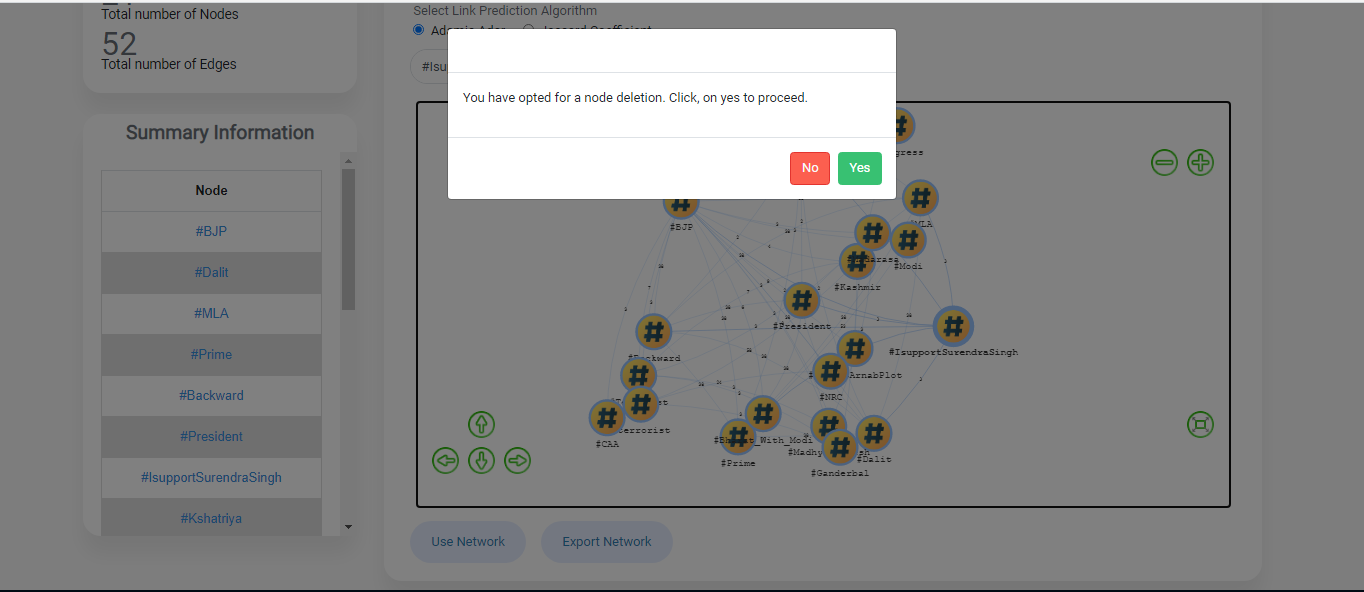
Deletion of a node from the Network
A node can be deleted from the network by double clicking on the node. It will result in the deletion of the node alongwith its related edges. The deletion can be made by double clicking on the node.
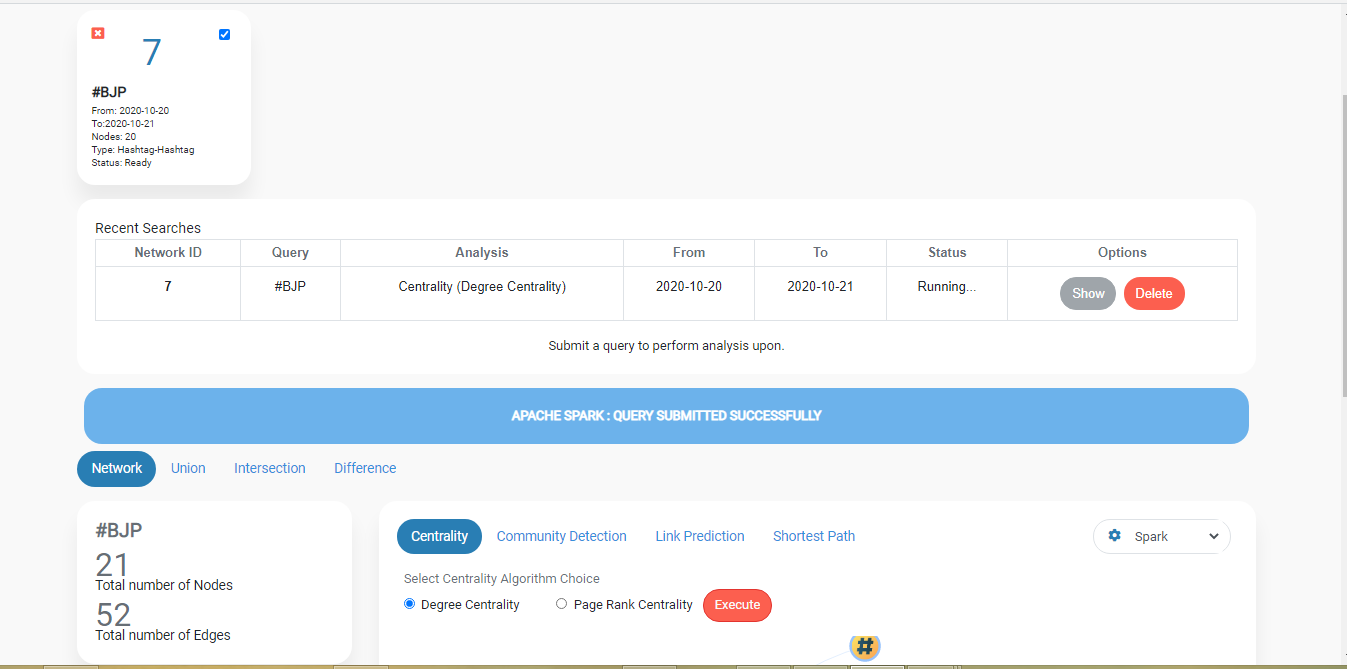
Distributed Processing of Large Scale Networks with Apache Spark
VISHLESHAKEE faciliates processing of large scale network with Apache Spark distributed computing framework.
VISHLESHAKEE is in its growing phases. With prospects of further addition of much detailed and fine-grained analytical components as a result of research and development activities from the lab, VISHLESHAKEE will emerge as an all-round social media analysis tool.
The Trending Page is for the public as well as for the registered users to analyse upto extent of 1Day on any Hashtag and Mention. The dashboard shows realtime analysis for any hashtag/mention such as its frequency distribution plot upto a granularity of 10 seconds, sentiment distribution plot upto a granularity of 10 seconds , the top mentions along with that hashtag/mention , the active users for that hashtag/mention , all the incoming tweets etc. Some more navigations for further analysis is also facilitated for a range of hr. If a user wants to perform analysis for a period more than 1 hr then the user has to register for an account to navigate to the Analysis section of our system.
The module provides few visualization for few different analysis namely :-
- Frequency Distribution
- Sentiment Distribution
- Top Co-occur Hashtags
- Top Co-occur Mentions
- Top Active Users
- Locations
- Tweet Information
The frequency distribution shows the frequency of tweets received for the current hashtag or mentions.The plot shows the incoming traffic (for the selected interval , in the picture it is set to 15mins.) for the tweets based on particular hashtag/mention with a granularity of 10 seconds .Along with the graph it also shows the total number of incoming tweets based on that hashtag/mention and at what time the maximum number of tweets arrived which is updated every 10 seconds
The sentiment distribution shows the sentiment of tweets received for the current hashtag or mentions.The plot shows the sentiments i.e postive , negative , neutral (for the selected interval , in the picture it is set to 15mins.) for the tweets based on particular hashtag/mention with a granularity of 10 seconds . Along with the graph the graph also shows the summary information like the percentage of total positive , negative , neutral tweets for a particular interval .
The chart shows the unique co-occuring mentions along with Hashtag/Mentions made by the user in the tweet . The chart is sorted in order of their co-occuring frequency . One can analyse the further by clicking on the columns of the chart. (only if the user is registered) .
The map shows all the locations people are participating from based on the analysed trending hashtag for an interval of time (15mins in the picture) .
The chart shows the unique users who has posted on that particular hashtag/mention along with its frequency . The chart is sorted in order of the frequency . One can analyse the user further by clicking on the columns of the chart. (only if the user is registered) .
The map shows all the locations people are participating from based on the analysed trending hashtag for an interval of time (15mins in the picture) .
User can see the raw tweets posted by people on twitter on that hashtag / mention for a range of interval(15mins in the picture) . One can see the sentiment of the date-time at which the tweet was posted , along with the retweets and quoted tweets by clicking on the icon .Also the user can redirect to the original tweet on Twitter by clicking on the twitter icon at the bottom of every tweets. A user can also see the sentiment of the tweets on the top near the user name . One can provide sentiment feedback by clicking on "Give Feedback" on dropdown and then a modal will appear to select the actual sentiment/category.