Our Research Focus Areas

Electroencephalogram (EEG)

Electroencephalogram (EEG) is the imaging modality we use for our investigations. This technique measures the electrical responses of the brain. Our interests lie in decoding these responses to study human brain behaviour and derive insights. Our ongoing projects are focused on multiple domains, particularly Android App development, neurocinematics and music perception.

Our Projects in the EEG domain:

Camera EEG
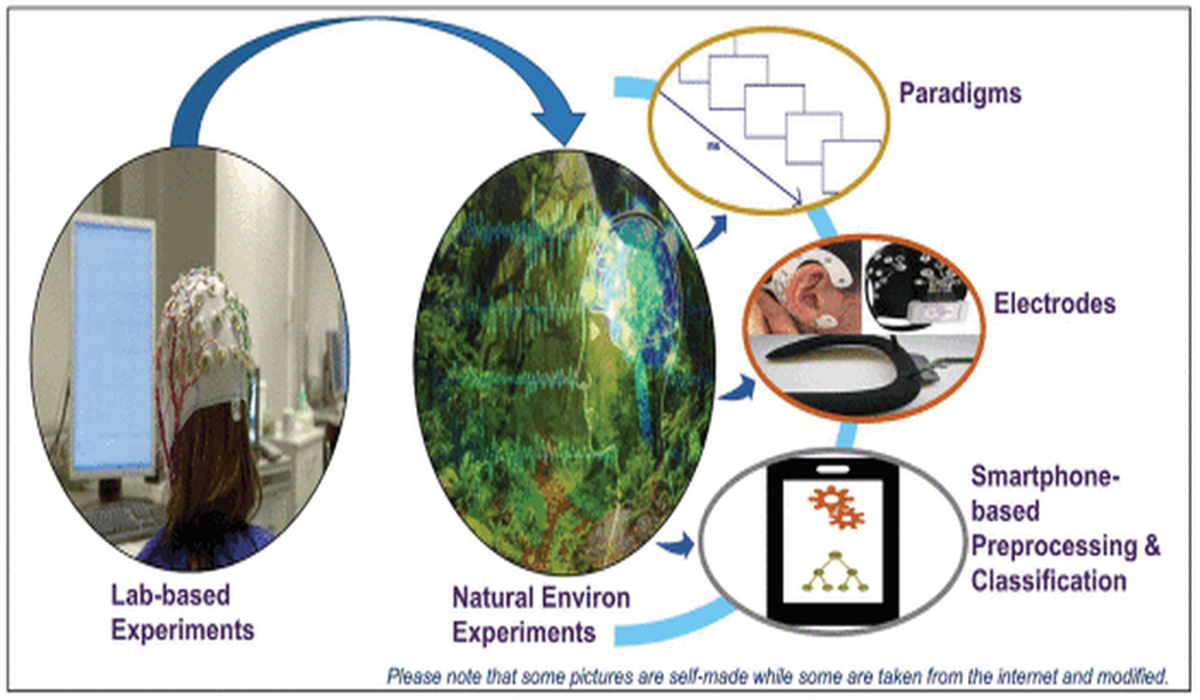
CameraEEG Android App helps in the recording of synchronized electroencephalogram signals and video data on a smartphone. The app has allowed us to conduct experiments not just within the lab but also, in natural environments.

Neurocinematics based BCI applications.

We are using deep neural networks to model EEG signals in the context of brain-computer interfaces. We have implemented an BiLSTM-LSTM based classifier for estimating the cognitive workload of a passiveBCI user. Currently we are developing a dynamic audio-visual stimulus presentation paradigm (Neurocinematics) and a software implementation of the experimental protocol for an EEG based BCI.

Interested! See the demo video

Multivariate/Multimodal Algorithms for NeuroImaging Big Data

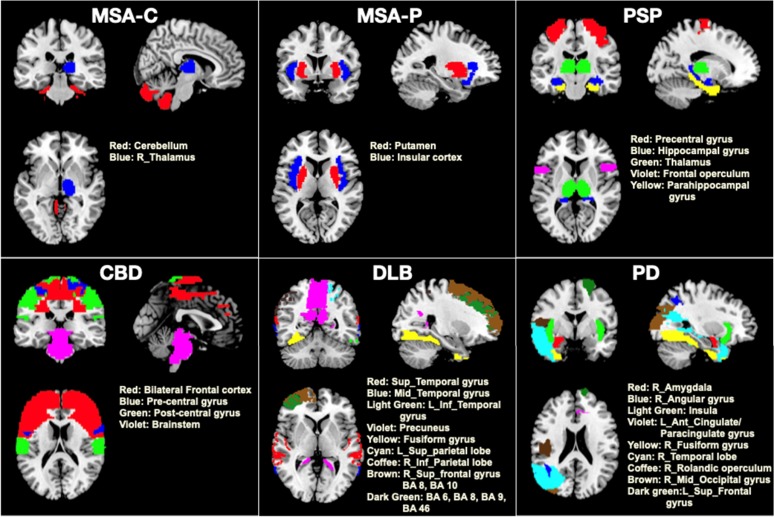
Subgrouping Parkinson’s disease (PD) is the second-most common neurodegenerative disorder with overlapping clinical, cognitive, task-based and motor features. Despite insights about the disease and clinical data based subgroups , distinct well-defined neuroimaging-based subgroups are not available for personalized treatment. Hence, due to heterogeneity in PD, we are investigating for stable data-driven PD subgroups. Assuming the presence of inter-subgroup differences in the brain, we hypothesize the existence of inter-subgroup brain network topology.

. Image Source : [Link to the Source].

Brain connectivity

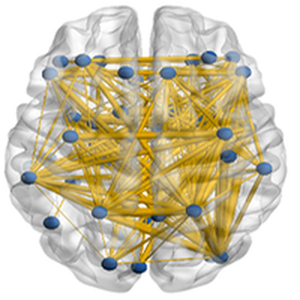
Brain connectivity elucidates how neurons and neural networks process information. The network patterns determine the structural and functional properties of neurons and neural systems. Structural maps indicate that each neuronal element maintains a specific pattern of connection with a few other similar and/or different neuronal elements. The region-to-region connections can be captured using regional gray matter volume from structural MRI. The structural network patterns are then obtained from correlations between regions based on the fact that if region A and B are related, then any change in region A will lead to a change in region B. Here, the nodes represent brain regions and edges represent link between them. Our group has found disrupted network topology in PD as compared to healthy control.


Image Source: [Link to the Source]

Click to know more