Projects
A glance at what we have done.
Current Thesis Projects

Visualizing the macroeconomics of India
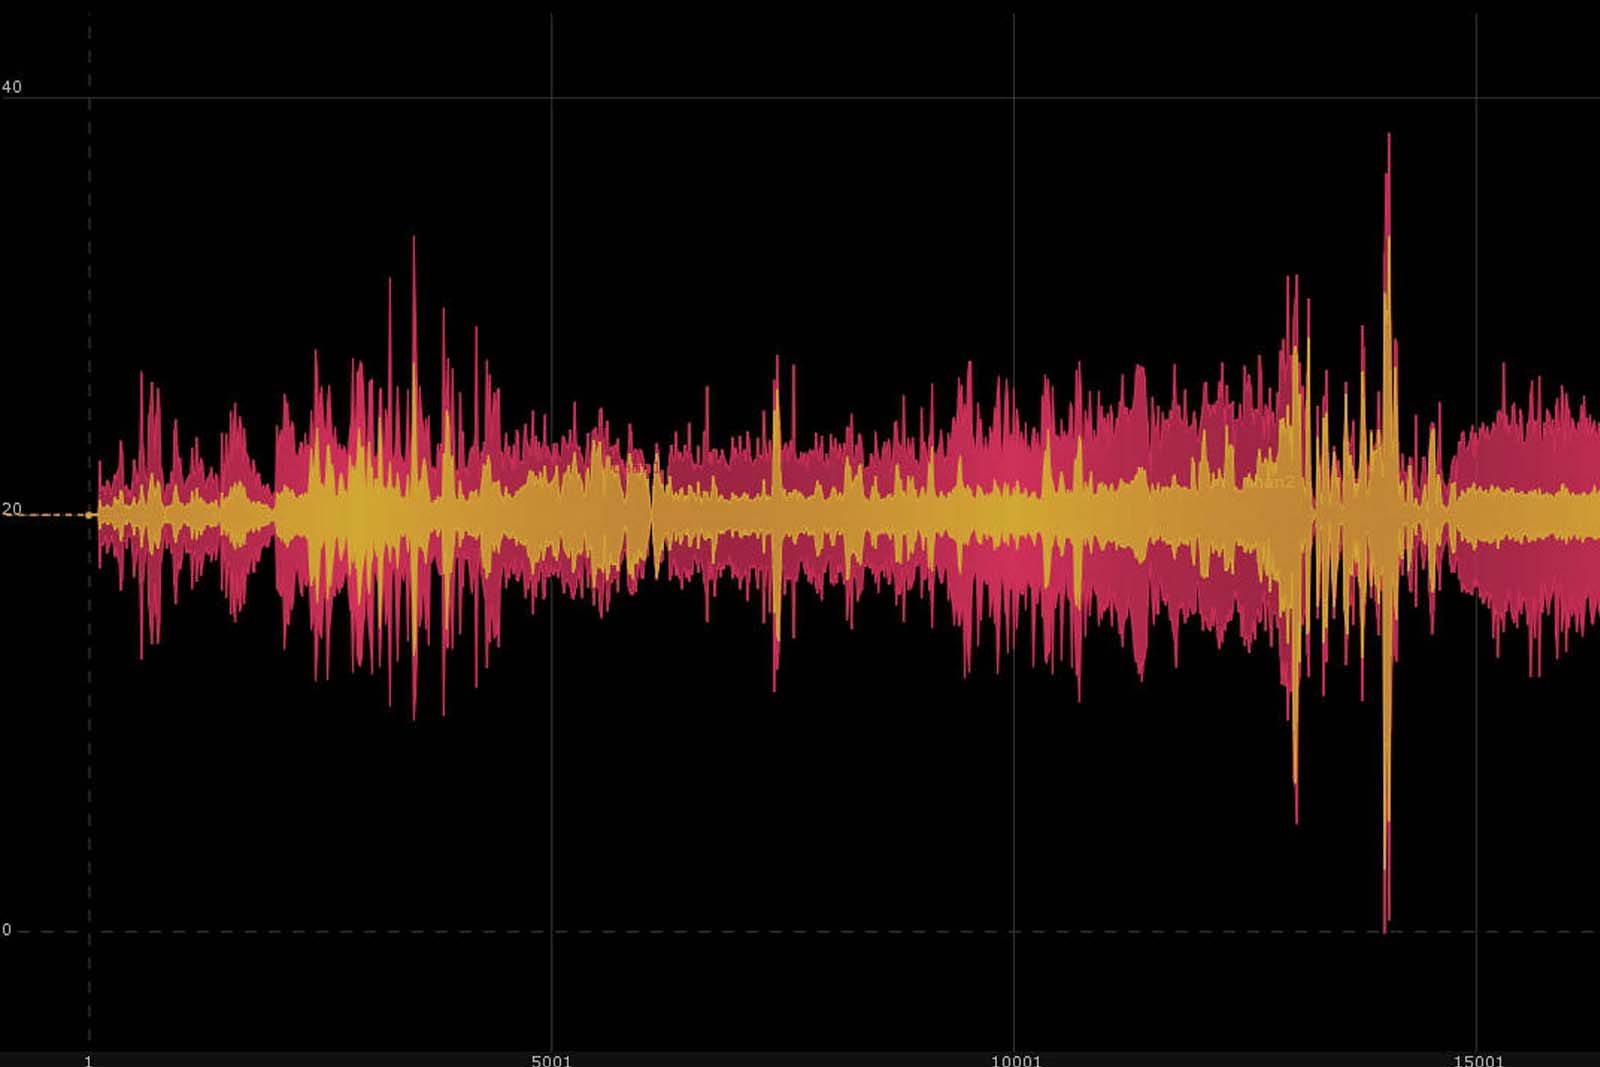
Visualizing the macroeconomic indicators of India is an attempt to make an average Indian citizen understand the big picture of the Indian economy. Consumer Price Index(CPI) a common lagging indicator for the economy which is a weighted average of 25 essential goods and services used by every Indian citizen on a daily basis. Data set for CPI has been created from 2011 onwards for all the 25 categories. The granularity of the data is monthly and it is further categorized according to states and as rural and urban. This time series visualization would be an interesting tool to inquire about how the prices of the same commodities vary across the time and geography. Also one can inquireabout how various geo political factors lead to rise and fall in the prices for these commodities.


